SEO report template: what a monthly SEO report should include (free PDF)
Short answer
A monthly SEO report should open with the business result: the number of customer inquiries and the cost per inquiry. Clicks, rankings and work done come after that. A good report fits its summary on one page: the result against the goal, 3–5 causes with evidence, next month's plan and the risks. Detailed data belongs in a portal or dashboard.
SEO report vs. SEO audit: two different documents
The report and the audit get mixed up even in agency offers, although they answer different questions. An SEO report is produced regularly for as long as you work with the agency and shows how many inquiries came in, where the changes came from and what the team will do next month. An audit is a diagnosis done once, at the start or after a major change such as a site rebuild.
| Feature | SEO report | SEO audit |
|---|---|---|
| Question it answers | What SEO delivered this month and what comes next | What is wrong with the website and what to fix |
| How often | Regularly, usually every month | Once: at the start or after a site rebuild |
| What is inside | Result, causes of change, work done, plan, risks | Technical errors, content, links, competitors |
| Outcome | An assessment of the agency's work | A prioritized list of changes |
A good report refers back to the audit: it shows which fixes from the list have already been implemented and what they achieved. If you get the same list of errors every month, that is not a report on work done, just a repeated audit.
The two documents complement each other. An audit at the start gives a task list for the first months, and subsequent reports show how that list shrinks and what it changes in traffic and inquiries. Without an audit, the agency has no plan to compare the report against.
5 sections of a good monthly report
The layout comes from the monthly report structure in our SEO playbook. The first page is the summary, while charts and keyword tables go into an appendix or the portal. The monthly comment in our client portal is built the same way (example below).
1. Result against the goal
The report starts with the number the company cares about. For a service business, that is usually customer inquiries from organic results (form, phone, email) and the cost per inquiry. For an online shop, it is revenue and the number of transactions from Google, and a local business should add calls and direction requests from its Google Business Profile. Next to it sit the monthly goal and the same month a year earlier. A year-over-year comparison filters out seasonality: a weaker December is not a decline if it beats last year's. Three sentences are enough: what the result was, how it compares with the goal and which way the trend is going.
Check the number of inquiries in two places: GA4 key events and the inbox or CRM where the inquiries land. GA4 does not show events from people who declined analytics cookies, and on a small site it does not fill the gap with modeled data, so it usually sees fewer inquiries than actually came in. A click on a phone number is not a call yet, either. If you can, add how many inquiries matched your offer and how many turned into a contract. If the company does not measure inquiries at all, the first report should flag that as a risk and propose setting up key events in GA4.
2. What influenced the result
This is where the agency gives 3–5 causes of the changes, each with evidence. Evidence is a Google Search Console screenshot with the date marked, the date a change went live on the site, or an algorithm update confirmed by Google. The sentence “rankings rose thanks to optimization” with no date and no page URL explains nothing. A good cause says what changed, when and on which pages, for example “a new pricing section on the service page, deployed mid-month; clicks on price-related keywords have been rising since that day”. The most common causes are:
- a change on the site: new content, a rebuild, a bug after a release;
- an algorithm update confirmed by Google on the Google Search Status Dashboard;
- a change in how results look, e.g. an AI Overview above the results: the ranking holds, but clicks drop;
- seasonality, which a year-over-year comparison will show;
- lost links or a competitor that has picked up the pace.
When results drop, a good report works through these causes one by one instead of blaming Google straight away.
3. Work done and its effect
A list of work with dates: new content, technical fixes, links acquired, changes to the Google Business Profile. For each item it is worth naming the page it concerns and whether the effect is already visible. Task names alone, such as “on-page optimization”, are not enough: the report should make clear what exactly was changed. If you pay by the hour, the report should state the hours. You do not have to wait until the end of the month for this kind of information: in our client portal, inquiries and the work log are updated daily and keyword rankings weekly.
4. Plan for the next month
The three most important tasks for next month, chosen from the list of all planned work. For each one: what it concerns, what effect it should have and how you will know. A plan with a single item, “further optimization”, gives you nothing to check. A good plan lets you compare what was announced with what was delivered in the next report.
5. Risks and needs
Things that could stall results, and what the agency needs from you: access to the site or a developer, content approval, a budget for articles, answers to questions about your offer. Changes outside the agency's control also go here, such as a new competitor in Maps. A risk section protects both sides, because a problem flagged in a report will not surprise anyone three months later.
Which metrics to show and where to get them
Every number in a report should have a source you can open yourself, ideally on an account registered to your email address. The table collects seven metrics that let you judge SEO, along with the traps that make it easy to present a result as better than it is. When two sources give different numbers, such as GA4 and your inbox, or your Business Profile and GA4, the report shows both and explains the gap instead of picking the more flattering one.
| Metric | Source | How to read it | Trap |
|---|---|---|---|
| Inquiries from Google (form, phone, email) and the cost per inquiry | GA4 (key events), your inbox or CRM, invoices | The main result of the month | Without key events this number does not exist, and GA4 leaves out people who declined cookies |
| Clicks and impressions excluding brand queries | Google Search Console | Year-over-year trend | Brand queries inflate the result |
| Rankings of keywords from the agreed list | Search Console or a rank tracker | Share of keywords in the top 3 and top 10 | With many keywords, the average position is misleading |
| Business Profile in Maps: ranking and customer actions | Measurement from 49 points (7×7 grid), Business Profile performance data | Percentage of points in the top 3, calls and direction requests | A single check from the office is a coincidence |
| Visibility in ChatGPT and Google AI Overviews | A fixed set of customer questions, weekly; visits from AI chats in GA4 | Percentage of answers that name the company | A single question proves nothing |
| Links acquired | A list with the URL, date and status | New referring domains to key pages, and whether the links are still live | A link count that ignores link quality |
| Technical health: indexing and Core Web Vitals | Search Console: Page indexing and Core Web Vitals reports | Key pages indexed; LCP within 2.5 s, INP 200 ms or less, CLS 0.1 or less | A 0–100 PageSpeed score is a lab test, not real-user data |
You can filter out brand queries in the Performance report in Search Console. Since November 2025, Google has offered a built-in branded and non-branded queries filter there, but not for every property: it is not available for URL-path or subdomain properties, or for sites without enough queries and impressions. Queries are classified by an AI-assisted Google system that sometimes gets them wrong, so it is worth checking how they were assigned. If you do not see the filter, add a query filter that excludes the company name and its variants, including misspelled ones. Brand traffic grows with recognition, advertising and word of mouth, so it says little about the SEO work.
Search Console keeps data for the last 16 months. That is enough for a year-over-year comparison, but older history cannot be recovered, so export the data every month or keep it in a portal.
It is worth agreeing the list of keywords to track before you start. It should include the phrases customers use to look for your services, not only the ones the site is already visible for. The report should note every change to the list while you work together.
Metrics from Maps and from AI answers rarely make it into agency reports, yet they cover places where customers also look for companies. A customer sees different results in Google Maps depending on where they stand, so a Business Profile ranking is measured on a grid of points around the company address, not from a single spot. Calls, direction requests and website clicks are shown in the Business Profile itself, in its Performance section. ChatGPT answers change from day to day, so AI visibility is measured with a fixed set of questions asked regularly. Search Console only helps in part: it counts clicks from AI Overviews together with the rest of Google results, and its generative AI performance report, available to all sites since August 31, 2026, shows only impressions in AI Overviews and AI Mode. GA4, on the other hand, shows visits from AI chats, for example from the source chatgpt.com or perplexity.ai. We describe how we do it on the AI search optimization page.
For technical health, a report needs just two things: whether key pages are indexed (the Page indexing report in Search Console) and whether the site meets the Core Web Vitals thresholds. Google considers LCP within 2.5 s, INP of 200 ms or less and CLS of 0.1 or less to be good when at least 75% of real-user page loads meet the threshold. The 0–100 score in PageSpeed Insights comes from a lab test (Lighthouse), not from customers, so it cannot replace the real-user data in the Core Web Vitals report.
Example: what a report looks like in the client portal
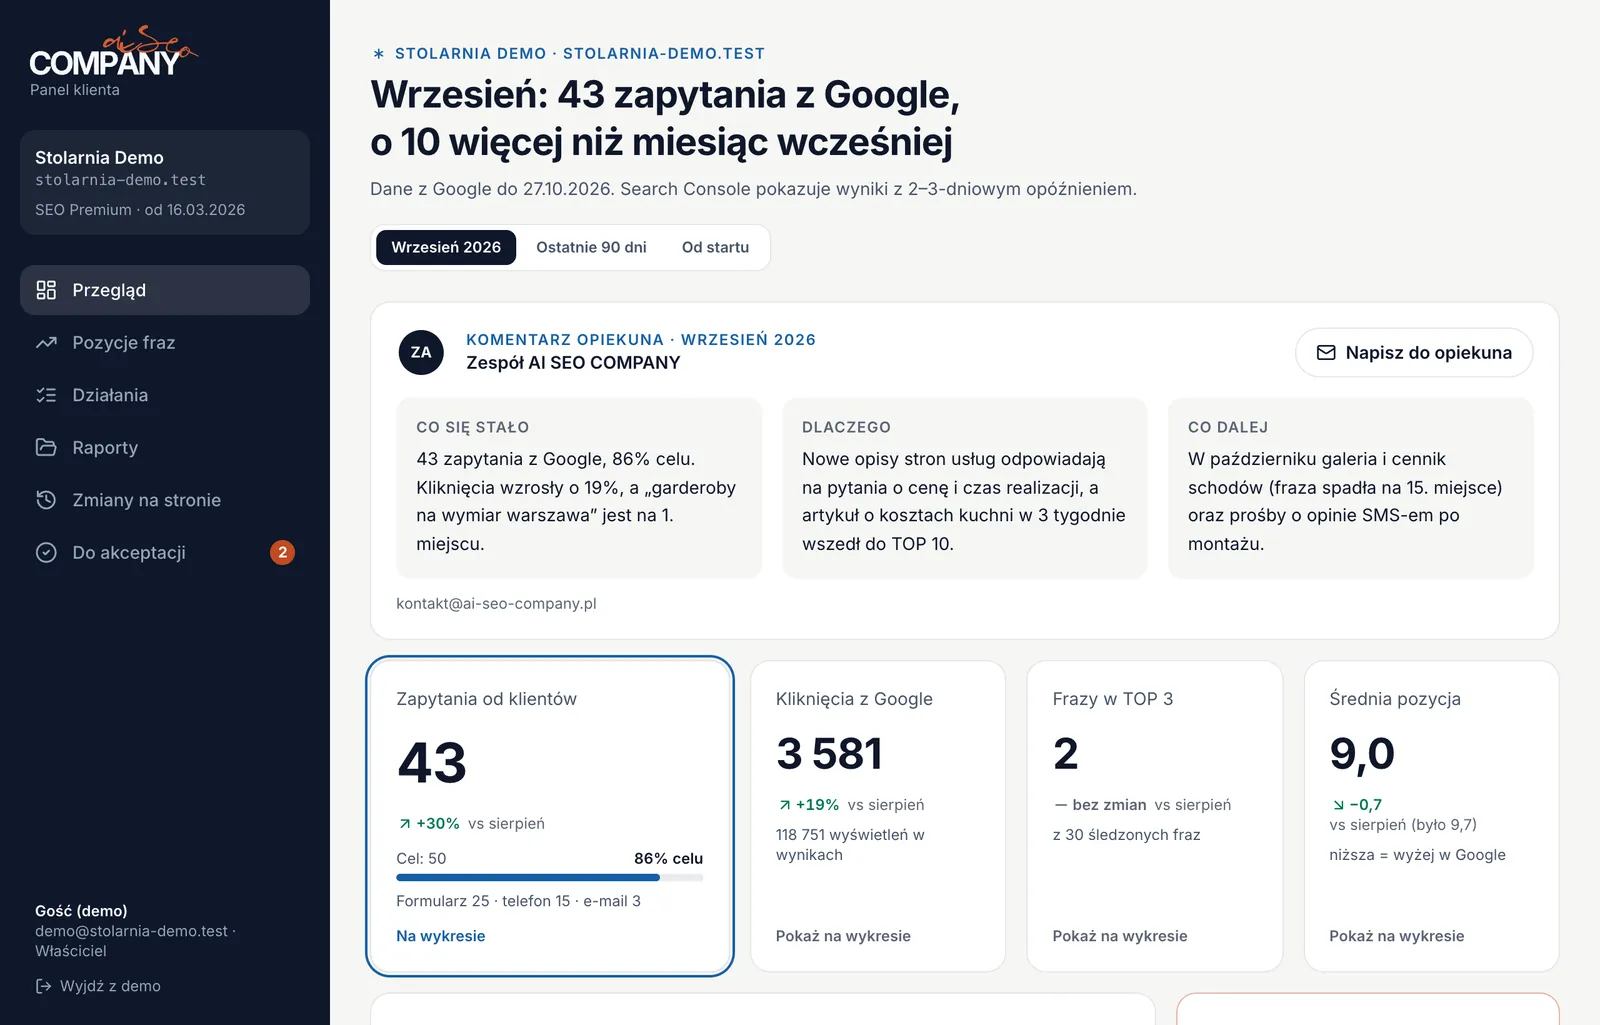
Two screens from the demo of our client portal, using sample data for a fictional company, "Stolarnia Demo". On the monthly overview, the account manager's comment has three parts: what happened, why and what next, which are sections 1, 2 and 4 of the template. The tiles under the comment show the result against the goal: customer inquiries split into form, phone and email, clicks from Google, keywords in the top 3 and the average position. The first number is customer inquiries, not rankings or traffic: every report should start that way. The tiles compare the result with the previous month. In a monthly report, add the same month a year earlier as well, because only that filters out seasonality.
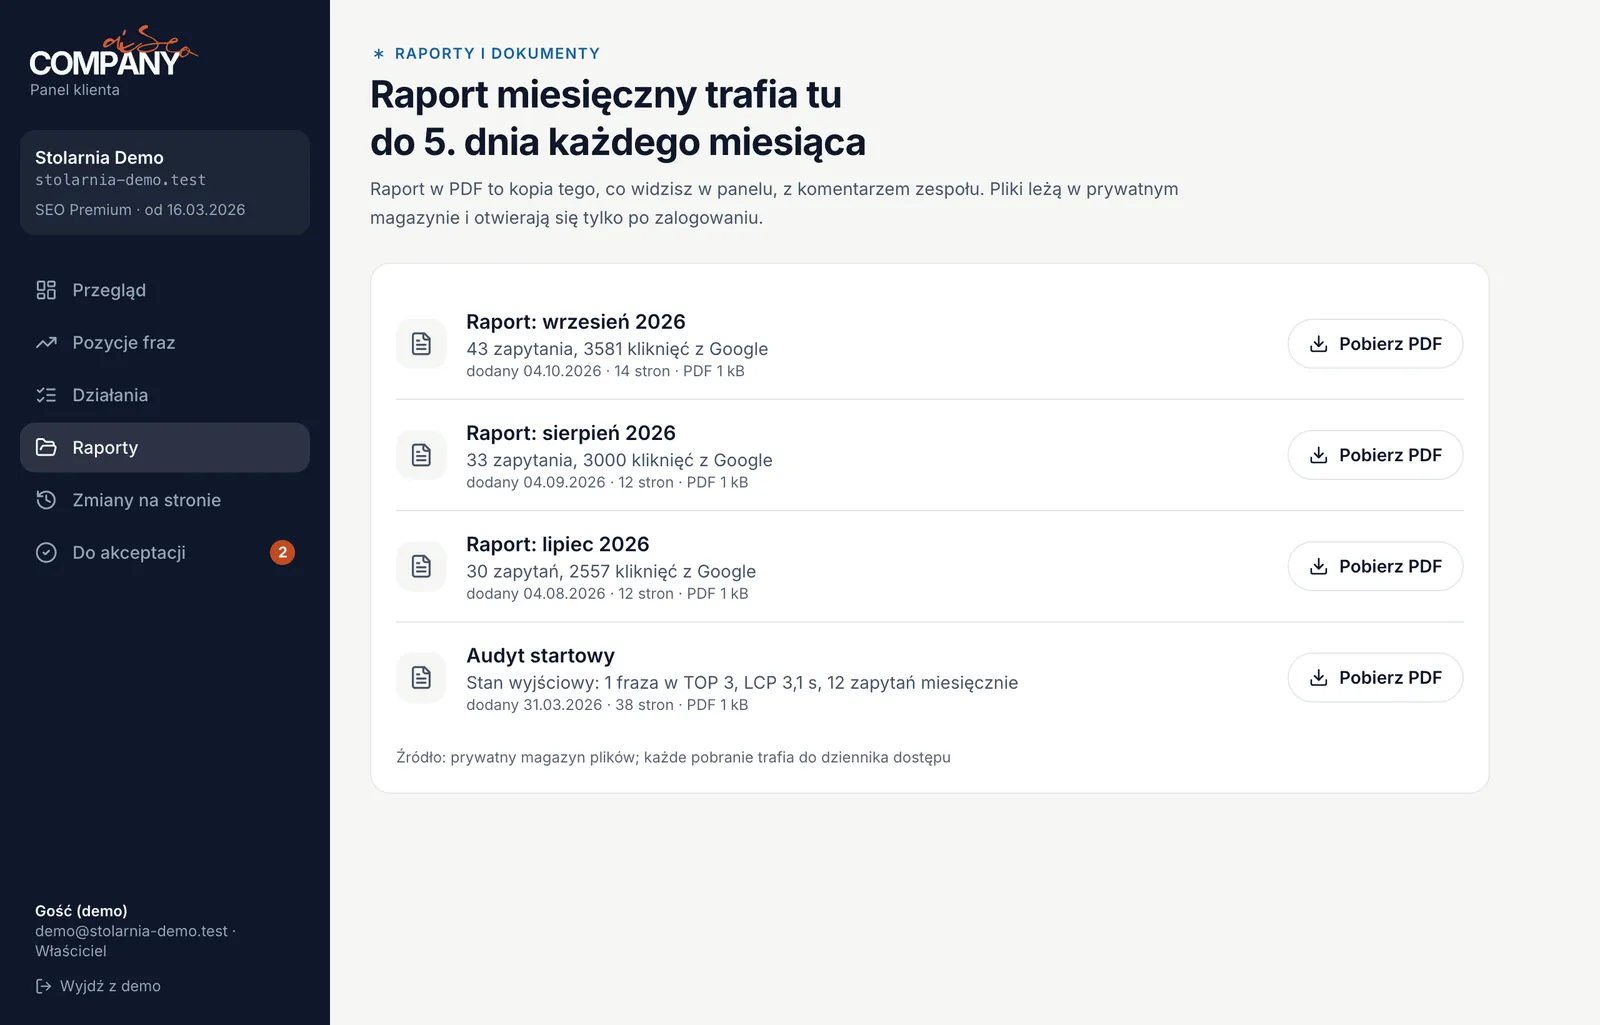
The Reports tab holds the monthly PDF reports and the starting audit. The PDF repeats what you see in the portal and adds the team's comment. So the report is not the only place with data: you can check the numbers at any time, without waiting for the end of the month.
Open the portal demo without logging in and go to the Overview and Reports tabs.
Red flags in SEO agency reports
Six signs that a report is hiding a lack of results or a lack of work. One is a reason to ask questions. Several at once are a reason to talk about changing agencies. Some of them come from convenience rather than bad intent: it is easier to send an export from a tool than to write a commentary. So start with a conversation and ask for a report based on the template you will find below.
- No number of customer inquiries. The report talks about traffic and rankings, but not about how many customers got in touch. Without key events in GA4, nobody knows whether SEO pays off.
- Rankings without a keyword list agreed at the start. The agency shows keywords where the site already ranks high, not the ones you agreed on. Growth built on such keywords can mean nothing for sales.
- “Visibility” with no definition or source. Without the name of the tool, the method and the keyword list, you cannot verify a visibility chart or compare it with the previous period.
- No dated list of work done. If you do not know what was done and when, you cannot link a change in results to the agency's work or to anything else.
- No year-over-year comparison. Month-over-month growth during peak season is often just the calendar, not the effect of SEO.
- Data only in a PDF. A report is no substitute for access to Search Console and Analytics on your own account. Without it, you are left with no data history when the contract ends.
Do you recognize several of them in your own reports? Read how to switch SEO agencies without losing rankings, and take your data with you before you terminate the contract. You can also book a free 30-minute online review of your previous agency's work.
Book a free reviewDownload an SEO report template (PDF)
The template has the five sections described above and a metrics table to fill in with data from Search Console, Analytics and your Google Business Profile. Print it or send it to an agency as a list of what you expect in the monthly report. Before signing a contract, ask which sections of the template you will find in the agency's reports. After a few months of working together, compare the reports you have received with the template: missing sections make good questions for your next meeting.
Related templates and tools
- SEO strategy template: the goals and KPIs your report measures results against
- SEO checklist: the measurement section checks that Search Console and GA4 key events collect the data a report needs
- SEO competitor analysis template: who to compare your rankings and AI visibility with
- Free SEO audit: a 1–100 score and a list of errors when you need a diagnosis rather than a report
Questions about the SEO report
An SEO report is a document in which an agency or specialist shows what SEO delivered in a given period: customer inquiries, Google traffic, keyword rankings and the work done. Do not confuse it with an SEO audit, which is a one-time diagnosis of a website with a list of errors to fix.
Once a month is enough for a summary, because SEO results change over weeks, not days. Current data such as rankings and inquiries should always be available in a portal or dashboard. Compare months year over year so you do not mistake seasonality for the effect of the work.
No. A tool report shows visibility and rankings, but it does not say how many inquiries came from Google, what the agency did or why the result changed. Each tool also calculates visibility its own way, from its own keyword database, so you cannot compare its chart directly with another source. Tool data makes a good appendix to a report, not its content.
If you want to assess your website rather than an agency's work, you need an SEO audit. Our free SEO audit checks up to 25 pages and gives a score from 1 to 100 and a list of errors with fixes. A full audit by a specialist covers the whole site: indexing, content, links, speed and competitors. Its scope and price are on the SEO audit page. You can also check for free whether ChatGPT recommends your company.
Sources
- Google Analytics Help: key events (accessed November 11, 2026)
- Google Analytics Help: behavioral modeling for consent mode (events from users who decline consent, traffic thresholds) (accessed November 11, 2026)
- Google Search Central: the branded queries filter in Search Console (November 20, 2025, updated March 11, 2026) (accessed November 11, 2026)
- Google Analytics Help: Queries report (Search Console keeps data for the last 16 months) (accessed November 11, 2026)
- Google Search Central: AI features and your website (data in the Performance report) (accessed November 11, 2026)
- Google Business Profile Help: profile performance (calls, directions, website clicks) (accessed November 11, 2026)
- Google Search Status Dashboard: confirmed ranking updates (accessed November 11, 2026)
- web.dev: Web Vitals (LCP, INP and CLS thresholds, 75th percentile) (accessed November 11, 2026)
- Search Console Help: Page indexing report (accessed November 11, 2026)
- Google: PageSpeed Insights (Lighthouse lab data and CrUX real-user data) (accessed November 11, 2026)
Have a project in mind? Let’s price it!
Fill out our quick form and receive a tailored proposal within 24 hours.
- Address: ul. Grzybowska 12/14 lok. B-3, 00-132 Warszawa
- Phone: 518 815 055
- E-mail: kontakt@ai-seo-company.pl
- NIP: 5253090237
- Response Time: Within 24 h on business days, usually sooner